At 06:15 UTC, BTC’s price pierced the 100-day moving average (MA) at $9,653, triggering a flurry of sell-orders as the mid-term trend switched from bullish-to-bearish.
Bearish market sentiment echoed throughout the world today as the international stock markets fell across the board with the SP 500 down 2.9 percent, while the FTSE 100 in the UK dropped by 1.42 percent.
That would seem to dispell the notion that BTC acts as a safe haven asset, offering certainty during darker economic time.
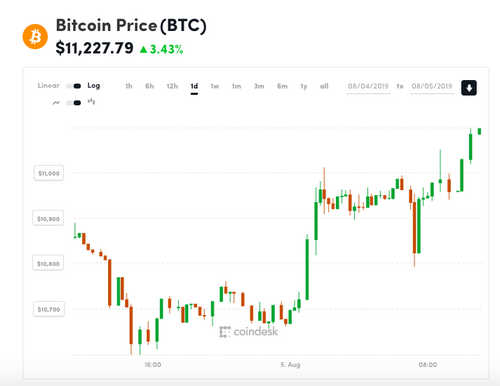
The world’s largest cryptocurrency by market capitalization has since recovered slightly and at time of writing is changing hands at $9,800 on Bitstamp, representing a 2.4 percent loss on the day.
- Total weekly volume for the bears is lower than expected, offering a small hope for a bullish rebound.
- Price would need a firm close above the 100-day MA in hopes of cementing a higher low relative to July 28’s dip low.
Bitcoin continues to tumble from temporary support levels at $10,000 after enduring its worst single-day loss in a month.
Regardless, the onus is now heavily on the bulls to regain a foothold back above the 100-day MA on the daily chart or risk further downside.
Daily chart
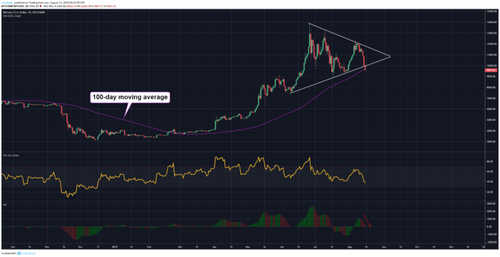
As can be viewed above, the symmetrical triangle breakdown is well underway after BTC’s price temporarily stalled along the 100-day MA at $9,652.
The bearish move is being supported by a histogram tick down on the awesome oscillator (AO) on the daily chart as it heads toward the neutral zero line, while the RSI fell bearish below 50 on August 13.
A failure by the bulls to close back above the key long-term moving average will undoubtedly spur further bearish pressure exposing lower weekly supports.
Weekly chart

A Fibonacci retracement drawn from 2018’s peak low at $3,122 to 2019’s peak high at $13,880 shows $8,501 to be the most likely landing zone in the coming week should its price close beneath the 100-day MA and July 22’s prior bearish weekly close at $9,533.
Total weekly volume may offer some hope for the bulls as it’s currently tracking worse than July 22’s levels when the price of BTC rebounded from a low of $9,111 to a high of $11,085 as a result of weakening bearish momentum.
Falling price alongside limited volume usually points toward bear exhaustion, and may offer up a reversal and a new higher low above July 22’s dip low.
That outlook will be determined by the end of the weekly closing period on August 18.