Bitcoin is again trading above $6,000 and looking up, but today’s closing price will likely set the tone for the rest of the week.
The leading cryptocurrency fell to $5,755 at 15:00 UTC on Sunday – the lowest level since Nov. 12 – only to make a quick recovery back above $6,000 an hour later, according to Bitfinex data.
The failure to capitalize on the drop, despite the long-run bearish technical setup, suggests that the bears are feeling exhausted, having pushed BTC lower by more than 40 percent (from $9,990 to $6,000) in the last seven weeks.
So, a relief rally may be in the offing, although it all depends on where prices close today (as per UTC).
At press time, BTC is changing hands at $6,150 – up 4.5 percent on a 24-hour basis.
Daily chart
BTC created a doji candle on Sunday, normally signaling indecision in the marketplace. However, when viewed against the backdrop of a 40 percent decline from May high of $9,990, Sunday’s doji candle likely represents bearish exhaustion.
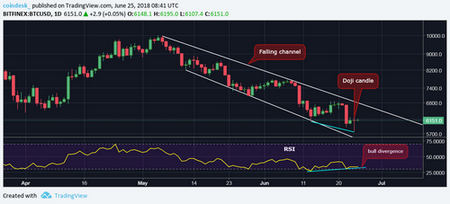
A notable relief rally could be in the offing if BTC closes today (as per UTC) above $6,250 (Sunday’s doji candle high), confirming a bullish doji reversal.
Further, the relative strength index (RSI) has begun to diverge in favor of the bulls: creating a higher low despite a lower low in price. So, a positive price action today would also confirm a bullish divergence there.
A confirmation of bullish doji reversal and bullish price-RSI divergence would improve the odds of a falling channel breakout.
While the short-term outlook stays bearish while BTC is stuck inside the falling channel (bearish pattern), the short duration chart does favor a relief rally in bitcoin.
4-hour chart

The bullish price-RSI divergence only adds credence to Sunday’s doji candle and suggests BTC will likely close today above $6,250 today, confirming a bullish doji reversal.
View
- A close today (as per UTC) above $6,250 will likely allow BTC to trade on a positive note for the rest of the week. In this case, the falling channel resistance (currently located at $6,800 and seen sloping downwards to $6,600 by Friday) could be put to test.
- A high volume falling channel breakout would open the doors to $7,700.
- Bearish scenario: An unexpected close (as per UTC) below $6,000 (February low) would open up downside towards $5,090 (rising wedge breakdown target).


