The price of ether, ethereum’s native token, is likely to head south unless the bulls can quickly pull the price back over $1,160 levels, price chart analysis indicates.
On Coinbase’s GDAX exchange, ether hit a one-week low of $905 at 11:50 UTC today. A sharp recovery from the last week’s low of $757 ran out of steam at $1,164 over the weekend. The subsequent drop to sub-$1000 levels has left a lower high (bearish action) on the charts. As of writing, the cryptocurrency is changing hands at $930 levels on GDAX exchange.
ETH has depreciated by 8 percent in the last 24 hours, according to data from OnChainFX. Further, prices are down 20 percent from the weekend high of $1164. Still, the technical charts are now showing oversold conditions.
The price charts indicate that ether will mostly likely erase the 22 percent gains made since last week’s low of $757 in a slow and steady manner over the next couple of days.
4-hour chart
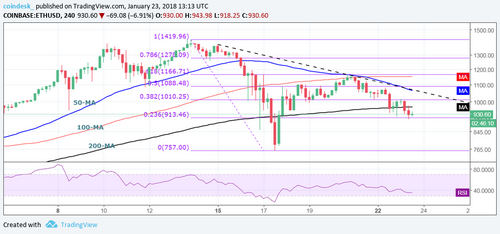
The above chart (prices as per Coinbase) shows:
- ETH left a lower high at the key 61.8 percent Fibonacci retracement level of $1,166.71 over the weekend. The decline witnessed in the following 24 hours yielded a bearish crossover between the 50-day moving average (MA) and 100-day MA (short-term average cuts long-term average from above).
- The rejection at 61.8 percent Fibonacci level indicates the corrective rally has ended and the bears have regained control.
- 50-day MA carries a strong bearish bias (sloping downwards), while the 100- and 200-day MAs are neutral.
- The relative strength index (RSI) shows scope for further losses (being below 50.00) and well short of the oversold territory (below 30.00).
Ether chart
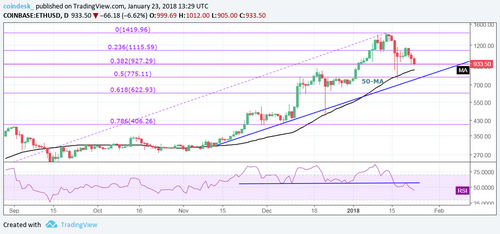
- The daily RSI shows a triple top breakdown-like pattern, indicating potential for a sell-off back towards to last week’s low of $757.
- The ascending trendline could offer support at $752.
- The 50-day MA is close to being topped out (shedding bullish bias).
View
- Ether looks set to close below $927.29 (38.2 percent Fibonacci retracement of the rally from the July low to January high) and extend losses to $775 (50 percent Fibonacci retracement) in the near-term. A violation there would expose trendline support of $752.
- A close (as per UTC) below $752 may signal a longer-term bullish-to-bearish trend change.
- Bullish scenario: A close (as per UTC) above $1,164.97 (Jan. 20 high) would revive the bullish view.