Bitcoin is stuck in a narrow range currently, but a breakout may lie ahead, the price charts indicate. Prices on CoinDesk’s Bitcoin Price Index (BPI) rallied to a high of $13,000 on Saturday, but the spike was short-lived as prices fell back to $11,096 at 20:59 UTC yesterday.
As of writing, BPI stands at $11,700 – up 5.4 percent from yesterday’s low. Still, the cryptocurrency is down 1 percent on a 24-hour basis, as per data source OnChainFX.
Interestingly, some in the investor community feel the U.S. government shutdown may have influenced the rise in BTC prices over the weekend. However, if history is any guide, BTC is unlikely to rally significantly on the political standoff in Washington.
For instance, during the last standoff (Oct. 1–17, 2013), BTC appreciated by 10 percent (not a huge move by BTC’s standards), as data from CoinMarketCap shows. Further, prices were largely range-bound in the run-up to the deadlock and began rising sharply after it ended.
That possibility aside, the price chart analysis indicates scope for a rally to $15,000 and above – if the narrow range ($11,000 to $13,000) ends with an upside break.
4-hour chart
The above chart (prices as per Coinbase) shows:
- BTC rallied to $12,500 as expected and extended gains to $13,000 over the weekend, yet failed to cut through the descending trendline resistance (marked by a circle).
- The failure at the trendline hurdle and a drop to sub-$12,000 levels only add credence to the downward sloping (bearish bias) 50-MA, 100-MA and 200-MA.
Bitcoin chart
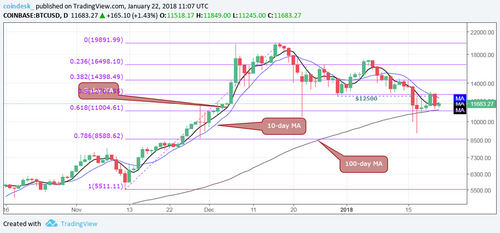
- Prices closed (as per UTC) above $12,500 on Saturday, signaling a short-term bottom is in place at $9,005 and potential for a rally to $15,000 levels.
- However, the follow-through was weak. BTC fell back to $11,500 levels yesterday and is currently trading at $11,700 levels.
- The reversal below $12,500 has neutralized the immediate bullish outlook. Meanwhile, BTC’s strong defense of 11,004.61 (100-day MA + 61.8 percent Fibonacci retracement) is keeping bears the bay.
View
- The bias is neutral as long as price remains stuck in the range of $11,000–$13,000. That said, risks are skewed to the upside, given the repeated rebound from near $11,000 levels.
- Only a close below $11,004 following a rejection at $12,500 would open the doors for a deeper pullback to $8,000 levels.
- On the other hand, a violation at $13,000 could yield rally to $15,733 levels (61.8 percent Fibonacci retracement of the sell-off from $19,891.99 to $9,005).

