Bitcoin cash (BCH) is trading on the back foot today, with technical analysis suggesting the market risks a bearish breakdown over the weekend.
At press time, the cryptocurrency has depreciated by 7 percent in the last 24 hours, according to data source OnChinaFX. On Bitfinex, the largest market for BCH/USD trading, bitcoin cash fell to $1,479 today; its lowest level against the dollar since Jan. 17. As of writing, it is trading at $1,599.
The development follows a sharp recovery from the Jan. 17 low of $1,343, which witnessed a follow-through buying in the subsequent days. However, the move ran out of steam at a high of $2,110 on Jan. 20 and BCH turned lower again, thus creating a lower high pattern (bearish pattern) on the charts.
That said, the 7 percent drop seen today is largely in line with the weakness in other cryptocurrencies.
For instance, BCH’s rival bitcoin (BTC) has dropped by 5 percent in the last 24 hours. Further, Ripple’s XRP token and Stellar’s XLM token are down 8 percent each, while ethereum’s ETH cryptocurrency is down 2 percent.
Bitcoin cash chart
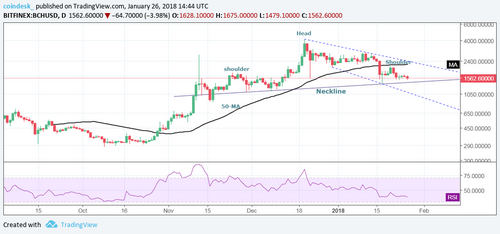
The above chart (prices as per Bitfinex) shows:
- BCH is creating head and shoulders bearish reversal pattern. A close (as per UTC) below the neckline would confirm a long-term bullish-to-bearish trend change.
- 50-day MA has shed bullish bias (topped out).
- Falling channel marked by downward sloping trendlines representing lower highs and lower lows.
- The relative strength index also favors the bears.
View
Confirmation of head and shoulders breakdown (close below $1,398 – neckline support) would open doors for a drop to $1,100 (Nov. 29 low) and possibly to falling channel support seen sloping lower to $1,050 over the next few days. A violation there would expose support at $851.12 (Nov. 17 low).
Meanwhile, the 50-day MA of $2,195 could be put to test if the bulls defend the neckline support and prices quickly move above $1,806 (Jan. 22 high).
On a larger scheme of things, only a daily close (as per UTC) above $2,400 would revive the bull run. Such a move would confirm upside break of the falling channel pattern and could yield $2,900-$3,000.