On the 6-hour timeframe, the volume profile visible range (VPVR) shows the price rejecting at the high volume node at $9,883 but at the same time, we can see that purchasing volume is beginning to outpace selling volume.
Compared to the price action of the previous two weeks, this weekend has been relatively relaxed for Bitcoin traders. On Saturday the price came within $10 of $10,000 before pulling back to $9,794 and at the time of writing the price continues to meet resistance at $9,900.
Despite the inability to hold above $9,900, the shorter timeframe also shows Bitcoin price painting higher lows since the drop on Feb. 19 to $9,352 and the price is also holding well above the 20-MA of the Bollinger Bands indicator.
A high volume surge could easily push the price to the upper Bollinger band arm at $10,126 but Bitcoin would still have some challenges ahead.
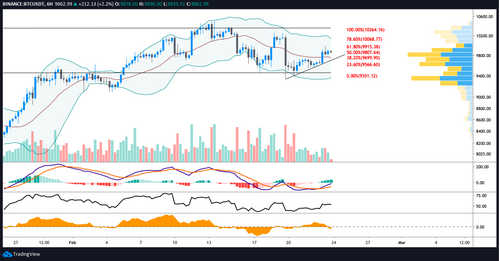
BTC USDT 6-hour chart.
If Bitcoin can hold the $9,850 support and push above $9,883, we could see the price rise to $10,200 as it is currently sandwiched between VPVR nodes at $10,210 and $9,892.
In an earlier analysis, Cointelegraph contributor Keith Waring explained that $10,000 is a less important level to attain when considering that a significant resistance at $10,300 awaits.
Waring also notes that even though Bitcoin’s current setup strengthens the probability of the price retaking the $10K mark, the CME close at $9,740 on Feb. 21 means traders believing in the CME gap narrative will hold their powder with the expectation of the price revisiting the gap.
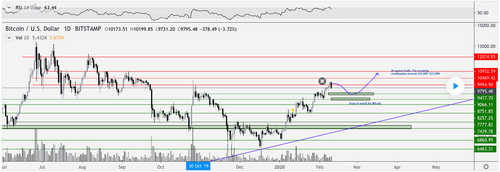
BTC USDT daily chart.
Meanwhile, crypto analyst Micheal Van De Poppe has taken a more bullish point of view, tweeting the above chart and saying:
“Retest done. As long as this level remains support, I’m expecting continuation towards $11,000 / $11,600.”
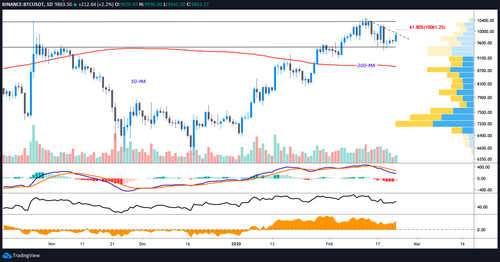
BTC USDT daily chart.
At the time of writing, Bitcoin price continues to push along the descending trendline at $9,989. A break above this trendline would put the price above the VPVR high volume node at $9,892 and closer to the 61.8% Fibonacci retracement. This would also strengthen the possibility of Bitcoin taking out the previous daily high at $10,250.
The daily relative strength index (RSI) is also making its way out of neutral territory as it currently climbs above 55. Another positive sign is the daily moving average convergence divergence (MACD) histogram painting a shorter, pink bar which shows selling is abating as bull volume increases.
For the short-term, we will look for Bitcoin price to push to $10,200 and watch to see if the digital asset can reclaim this resistance as support as this would set the price up for another go at $10,300. In the event that the price does drop to fill the CME gap at $9,740, traders will likely view this as a purchasing opportunity since Bitcoin has found support at this price since Feb.7 and below $9,740 there has is also support at $9,450.
The views and opinions expressed here are solely those of the author and do not necessarily reflect the views of Cointelegraph. Every investment and trading move involves risk. You should conduct your own research when making a decision.


