This continued decline was anticipated in last week’s analysis, with fingers pointing to China’s week-long Golden Week as a possible catalyst for the reduced trading volume.
This week isn’t looking good for Bitcoin as the price continues to decline after reaching a high of $8,540 on Oct. 1 down to $7,870 on Oct. 6.
However with the Chinese set to return to their desks next week, will they be buying the dip, or sitting on the sidelines for the new support being flagged across the charts?
A sidewards week for Bitcoin
Using the 1 day Bitcoin chart, last week’s trading range was expected to be between $7,600 and $9,500 as per the dynamic support and resistance on Bollinger Band indicator. However, very few trading opportunities presented themselves as the Bitcoin price stayed planted in the middle around $8,200.
When Bitcoin is locked in a sidewards range, it means that an equilibrium between buyers and sellers is met. This essentially means we are consolidating before either the previous trend continues or reverses.

BTC USD 1 day chart.
Is $90,000 Bitcoin really on the cards?
Not a week goes by without some outlandish claim that Bitcoin will soar to epic all-time highs in the immediate future, and last week was no exception. As reported by Cointelegraph, state-backed German bank Bayerische Landesbank published a report that predicted $90,000 Bitcoin was entirely likely with the forthcoming halving in May 2020.
However, this valuation was mirrored by Fundstrat’s Tom Lee back in March 2018 where he predicted an almost identical valuation of $91,000 within a similar timescale.
There are traders who would love to know how these analysts arrive at these figures because realistically speaking the charts aren’t showing anything like this in the short term.
In fact, contrary to these pie in the sky valuations and as much as traders would love to agree with them, the immediate future for Bitcoin looks bearish. Major indicators such as the Moving Average Convergence Divergence (MACD) and Bollinger Bands (BB) are warning that the next trend will be that of a downwards one, not an upwards one.
The MACD turns neutral
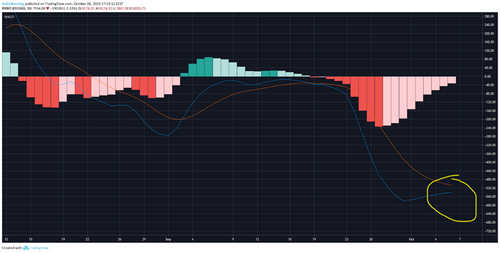
BTC USD 1 day chart
Last week it looked as though the MACD was going to cross up through the signal line, which would have meant a short bullish reversal.
It didn’t happen! Instead, both lines started to open up which could lead to them running parallel in a downward fashion. This is something to keep an eye on, the moment the blue line crosses up is the moment Bitcoin holders can breathe a sigh of relief, but for now it looks neutral.
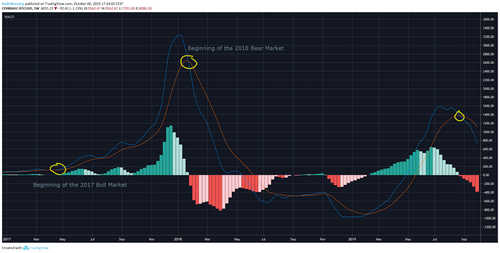
BTC USD 1 week chart.
The weekly MACD however, is not so neutral. It’s worth noting that this particular indicator on the weekly timeframe not only called the bull market in April 2017 when Bitcoin was little over $1,100, but it also crossed short on the 22nd of January in 2018 which signaled the beginning of the bear market. What we’re seeing now is a similar yet less steep pattern to that of the latter with no signs yet of it reversing.
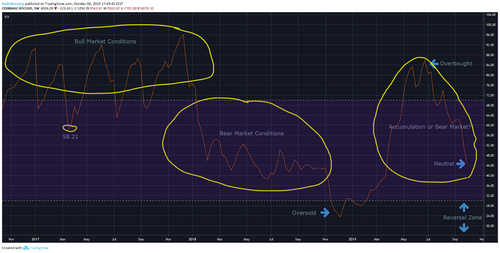
BTC USD 1 week chart.
Keeping on the weekly Bitcoin chart, the RSI is yet to show any signs of a reversal either. With a reading currently in the high 40’s, it’s undoubtedly neutral. The last time it was in this range was April 2019 when the price was trending upwards. It took the RSI 2 months to find a peak before it started its descent from being overbought.
Whilst a reversal at this stage is entirely possible, it would be out of character based on previous movements, as the lowest it bounced from overbought was above the middle line at 58.21. Right now it’s too early to tell, however, it is easy to understand why so many are sharing a bearish bias.
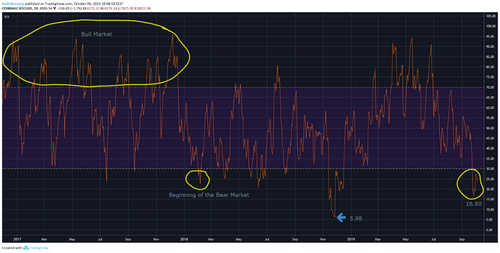
BTC USD 1 day chart.
Daily RSI
Zooming out on the RSI on the daily chart is essential to gauge what is happening right now. At first glance, Bitcoin looks oversold and ripe for a bounce. This might lead traders to shout hooray, but this means very little on the daily timeframe.
Bitcoin was consistently overbought in the bull run in 2017, and what is being shown now is a similar position to that of the beginning of 2018 as Bitcoin plunged into the depths of the bear market.
Yes, Bitcoin ranged above and below the overbought and oversold markers in 2018, but it didn’t produce any significant increases until after its final dagger down to 5.98 in November 2018.
Whilst past performance isn’t necessarily indicative of future performance, it may be worth taking into consideration. The lowest we have seen on the RSI this last week was 16.80 and currently the RSI is in the mid-’20s, which was zone frequently visited during the bear market.
What insights do the Bollinger Bands provide?

BTC USD 1 day chart.
The Bollinger Bands on the Bitcoin daily chart have opened nicely and provided some fresh support and resistance levels to work with.
The support has extended from last week’s $7,600 down to $7,120. A level not seen since the middle of May 2019. This is a critical price for Bitcoin to hold, as the ramifications of it breaking this level of support become evident on higher time frames.
However, since Bitcoin is currently sitting just a few hundred dollars from the support, the upside gives two targets for resistance. The first being the moving average (MA) on the Bollinger Bands which is $8,890 and the second being the upper band resistance of $10,672.

BTC USD 1 month Bollinger Bands chart
The doom and gloom scenarios for Bitcoin are painted all over the monthly chart. The digital asset is seeing the second red monthly candle, which again at the risk of sounding like a broken record, also occurred at the beginning of the bear market. Bitcoin needs to remain above the BB moving average at $7,000 to avoid unleashing a new bear market.
Whilst the lower band BB support is $2,500, it’s unlikely that price will drop this low as even in the depths of the 2018 bear market Bitcoin rejected levels in the early $3,000 range. This is an important time frame to watch and though bulls may be screaming at the screen in disbelief, this is what the charts are showing.
The weekly Bollinger Bands restore a bit of hope
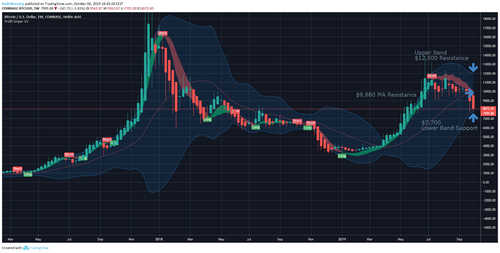
BTC USD 1 week Bollinger Bands chart
This is the last chart in this week’s analysis and fortunately the best has been saved for last. The lower band support of $7,700 has been rejected in recent weeks, which means Bitcoin could begin the trek towards the Bollinger Bands moving average which is at $9,880.
Should Bitcoin break this level, whilst the resistance targets on the daily are conservative, they are anything but on the weekly and $12,000 is the next level of resistance on the upper bands.
Whilst this won’t play out over-night, this target is possible before the end of the year if Bitcoin continues to reject the support levels in the low $7,000 region.
Bullish scenario
If Bitcoin successfully rejects the support of $7,120 and marches above $8,890 there is hope for the bulls. A continued upward trend above and beyond $9,880 would put the bulls back in control for the time being.
If the unexpected occurs and Bitcoin rallies past $10,672, then the last stop before new yearly highs is $12,000.
Bearish scenario
Bitcoin will be in a dangerous position if it breaks below $7,120, however, should Bitcoin fall to this level and then break down even further past $7,000 it’s not good news. This level represents a critical moment for Bitcoin, and new yearly lows will be in sight for the bears with an 80% retracement from the year high looking plausible towards the $2,500 region.