The bitcoin (BTC) market appears to have ended its six-week-long correction on Wednesday, making way for a retest of key resistance at $13,200.
Put simply, Wednesday’s UTC close confirmed an end of the pullback from the June 26 high of $13,880 and a revival of the bull market.
Hence, the doors look open for a rise to $13,200 – a bearish lower high created on July 10.
The leading cryptocurrency by market value closed just above $11,940 on Bitstamp yesterday, confirming an upside break of the falling channel represented by trendlines connecting June 26 and July 10 highs and July 2 and July 17 lows.
- Bitcoin is looking north, with the daily chart reporting a bearish channel breakout following a six-week-long correction. A retest of highs above $13,000 could be in the offing.
- The bullish case would strengthen if prices rise above $12,145, invalidating consolidation or exhaustion signaled by Wednesday’s candlestick pattern. A stronger confirmation of a bull revival would be a weekly close (Sunday, UTC) above $12,000.
- A break below Wednesday’s low of $11,388 would weaken the bullish case. That level could come into play in the next 24 hours if the symmetrical triangle seen on the hourly chart is breached to the downside.
So far, however, BTC has not been able to capitalize on the bull breakout. As of writing, the cryptocurrency is trading at $11,850 on Bitstamp, having hit a high of $12,031 earlier today.
Traders may want to see BTC settle above $12,000 before hitting the market with fresh bids. After all, the cryptocurrency has repeatedly failed to hold onto gains above $12,000 in the last six weeks, as discussed yesterday.
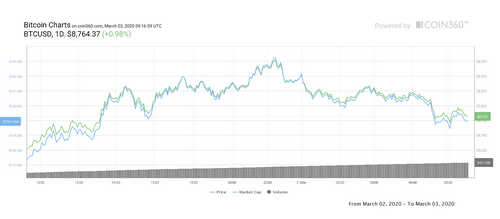
Daily chart
The bearish channel breakout indicates the path of least resistance is to the higher side.
The breakout would gain credence if prices clear Wednesday’s high of $12,145. That would invalidate exhaustion or mark an upside break of consolidation represented by yesterday’s inside bar pattern.

An inside bar occurs when the high and low of a candlestick falls within the preceding day’s price action. Essentially, it represents consolidation after a big move (or bull exhaustion).
The bullish case put forward by the channel breakout would be invalidated if BTC prints a UTC close below the inside bar’s low of $11,388. That would confirm a bearish inside bar reversal and allow a deeper drop toward $10,000.
Crypto trader and analyst Josh Rager argued on Twitter “it’s far riskier being bearish at this point in time”, suggesting only a break below $11,000 would shift risk in favor of a drop to $9,000.
Hourly chart
BTC has carved out a symmetrical triangle (narrowing price range) on the hourly chart.
A move above the upper edge of the symmetrical triangle, currently at $12,000, would imply a continuation of the rally from lows near $9,100 seen on July 28.
Symmetrical triangle breakdown, if confirmed with a move below $11,693, would expose support at $11,388 (the inside bar’s low).