The monthly candle closed yesterday, which can only give a bullish conclusion. A potential new upwards trend has started, given that buyers stepped in during January at every support/resistance test.
Bitcoin price (BTC) kicked off 2020 with an incredible 37% gain in the month of January. Aside from that, support was found at $8,200 earlier this week. This support test resulted in a continuation of the upward momentum, leading the price towards $9,500.
Is the price of Bitcoin ready to face $10,000?
Bitcoin shows strong monthly candle for January
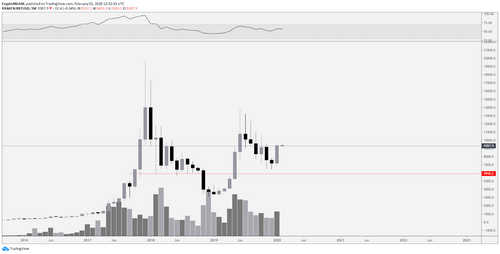
BTC USDT 1-month chart.
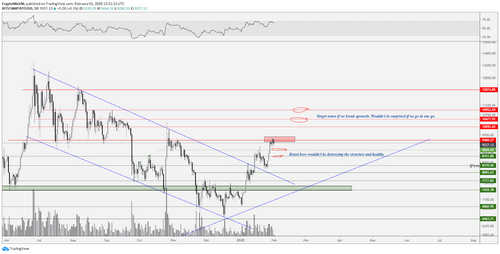
However, is it all sunshine and rainbows at the moment? Not completely. The price of Bitcoin has now moved towards the next resistance, and this one can be defined as a major hurdle, as shown by the following chart.
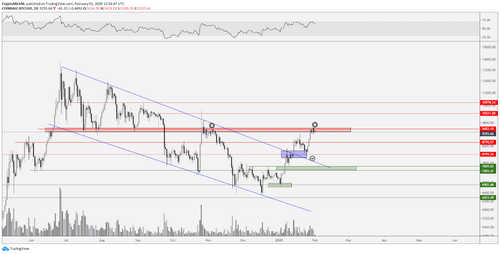
BTC USD 1-day chart.
The resistance at $9,500 is massive, given that the price bounced multiple times on this level throughout the summer of 2019. If a breakout upwards occurs, continuation should be likely towards $10,900, and that would break the psychological barrier at $10,000.
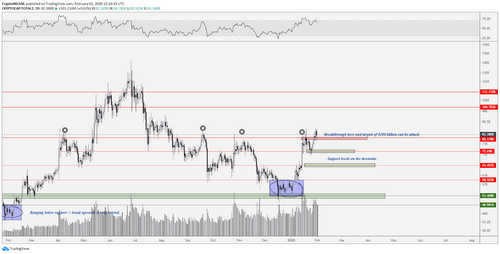
Total market capitalization breaks a major resistance

Total market capitalization 1-day chart.
The total market capitalization of cryptocurrencies is showing a clear test of the $215 billion levels for support, which was needed. After this, the market capitalization rallied towards another massive resistance. This level is found at $240-245 billion and is comparable to the level of $9,500 for Bitcoin.
However, there’s a difference here. The total market capitalization already broke above this level and is currently turning it in to support. Does this imply that altcoins are outperforming Bitcoin?
It should be noted that there is also a bearish feature that can be observed on the chart. If the total market capitalization breaks below the $240 billion level, the potential bearish divergence becomes a confirmed bearish divergence. Another test of the $215 billion levels (the blue trendline) would be likely in this case.
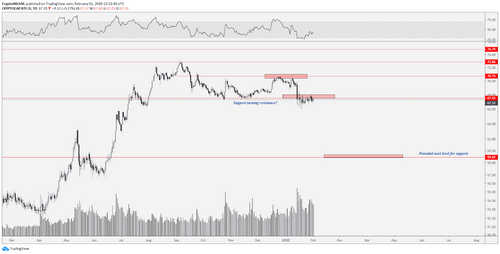
Altcoin market capitalization breaks the $80 billion barrier
Altcoin market capitalization crypto 1-day chart
The altcoin market capitalization is showing a similar chart as the total market capitalization. The critical level of $80 billion is broken to the upside, after which consolidation started.
The same notions are also stated for the altcoin market capitalization chart. If there’s a break below the $80 billion levels again, the bearish divergence becomes confirmed, and retests of the $72 and $65 billion levels are likely to occur.
However, on the bright side, if $80 billion is held as support, continuation towards $100, which is also the next resistance.
Bitcoin dominance still hovers below 68%
BTC Dominance 1-day chart.
The dominance chart for Bitcoin didn’t change much in the recent weeks as major altcoins are still facing significant resistances. Currently, the most prominent examples would be (XRP) and Ether (ETH). XRP needs to break a 2-year old downtrend, while Ethereum needs to break above 0.02 satoshis to continue higher.
If either of these two movements occurs, a continuation to the downside is likely for Bitcoin’s dominance. However, if Bitcoin itself starts to run above $9,500, a selloff on altcoins wouldn’t be a surprise. Such a selloff frequently occurs when Bitcoin’s volatility increases.
ETH USDT 1-day chart.
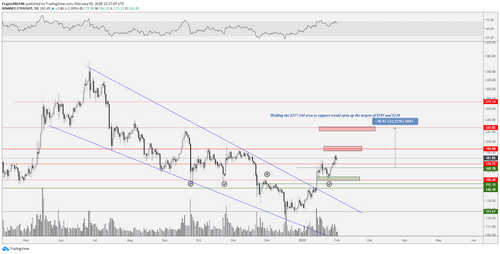
The primary indicator for altcoins is Ether, which also broke a 7-month downtrend, as the chart shows.
Recently, the price found support at $157 (green zone) and continued to rally. A similar support/resistance flip occurred at the $173 level, which makes me believe that a continuation towards $195 and $230 is likely.
As many charts are showing potential bearish divergences, a breakdown of Ether below $173 would generally mean a retest of $157-162 before further upward momentum. The key indicator for trends is still found in higher highs and higher lows. If Ether price breaks below $157, then the crypto market is in trouble.
The bullish scenario for Bitcoin
BTC USD 1-day bullish scenario
The bullish scenario is the main scenario at this point, given that the trend is moving upwards after the breakout of the 7-month downtrend.
Key levels to watch are the $9,000 level and $9,500 level. The reasoning behind $9,000 is that it could be tested for support before the price continues to rally above $9,500. A retest of $8,750 and $9,000 is still healthy for the market structure, as the price of Bitcoin will still make higher lows.
An apparent breakthrough of the $9,500 level would indicate a breakout above a significant resistance, as discussed in the article.
If the price breaks through this level, targets will be found at $10,500 and $10,900. I don’t see resistance at $10,000 other than the fact that round numbers typically function as psychological barriers.
The bearish scenario for Bitcoin

BTC USD 1-day bearish scenario.
A bearish scenario would become valid if Bitcoin lost the $8,200 level. Losing this would signal that the momentum of higher lows is gone and further downward pressure would be expected.
Thus, what signals should traders look for in order to determine that Bitcoin has become bearish? If the price makes a retest at $8,750, the bounce should be severe enough to break back above $9,000. However, if resistance is immediately found and the price makes a lower high then continuation to the downside is warranted.
But, price first needs to arrive at these levels to determine how traders and investors react. The momentum is up for now, and when the price of Bitcoin breaks above $10,000, FOMO (fear of missing out) could start to kick in. Especially given the halving is now just 100 days away.

