This bounce was heavily needed after a massive red candle the week before. However, is the upward momentum back in the fields? Or is it just a dead cat bounce before more downside?
The crypto markets are experiencing a small relief rally during the week, as the price of Bitcoin bounced from $8,400 towards $9,150.
During the week, Bitcoin has seen a breakthrough in the $9,000 level, which is currently providing support for the markets.
Bitcoin breaks back above $9,000, but can’t break $9,150 resistance
However, given that the price of Bitcoin lost the $9,400-9,600 support area, means there’s a substantial amount of resistance lying above us to break through.
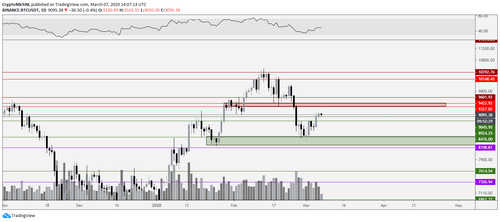
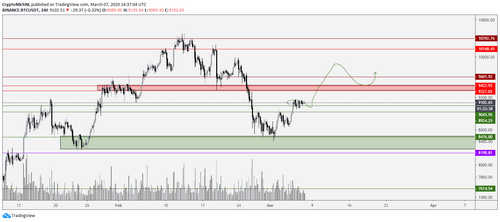
BTC USDT 1-day chart.
The daily timeframe shows that the $8,200-8,500 area managed to hold for support, after which price jumped to the current price of $9,100. The daily candle of yesterday closed above $9,050, as that level is regained for support. A critical level to hold right now, as it can warrant continuation towards $9,300-9,400 as the next major pivot.
For a continuation and bullish perspective, the price of Bitcoin needs to break back above $9,300-9,400 and preferably $9,600. If either of these levels becomes resistance then the levels are tested as a bearish retest and downwards tests are evident to occur.
If a bearish retest occurs, the primary support zones are found at $8,200 and possibly $7,500.
Weekly holds the 21-MA for support
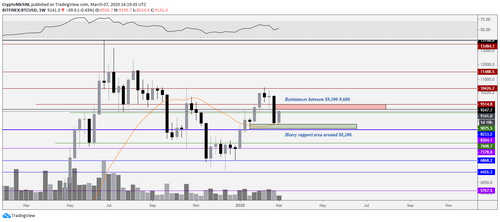
BTC USDT 1-week chart.
The weekly chart of Bitcoin is showing that the 21-week Moving Average (MA) is currently holding the price of Bitcoin. That’s essential since the moving average served as support through the previous bull cycle of 2015-2017. Hence, it’s a significant indicator for traders for bullish and bearish momentum confirmation.
However, as discussed in the previous section, the resistances are found between $9,300-$9,600 and are essential to break to sustain further upwards momentum.
The supports are found at the 21-week MA and further around $8,200 as there’s a monthly and weekly level lying there. Losing the $8,200 level regularly gives a continuation towards the $7,400-7,600 area.
Bitcoin stuck in a range on the smaller time frames

BTC USDT 2-hour chart.
The 2-hour chart of Bitcoin is showing clear range-bound movements in the past few days. The price of Bitcoin has found resistance at $9,150-9,180 and found support between $8,950-8,980.
Another support level is found at $8,900-8,920. As long as that level remains support, a continuation upwards and test of the $9,300-9,400 is on the table.
Total market capitalization holds $230 billion level
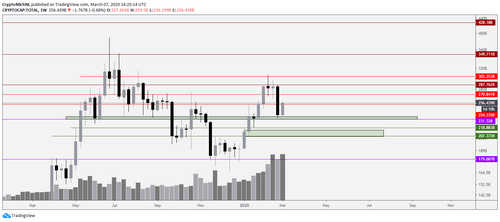
Total market capitalization cryptocurrency 1-week chart.
The total market capitalization chart of cryptocurrency is showing a strong bounce from the $230 billion level. However, the weekly candle before shows a sharp selloff, indicating that some more things need to occur to maintain a bullish outlook.
One of them is reclaiming old support levels. Therefore, the weekly candle should close above $252-254 billion. If the total market capitalization closes above it, it’s likely to see continuation towards the next levels around $270 and $280 billion.

Total market capitalization cryptocurrency 1-day chart
The daily chart of the total market capitalization is showing an apparent breakthrough in the $252-254 billion levels. As long as that level remains support, the path towards $270-271 billion is open, which is pretty similar to the $9,300-9,400 area of Bitcoin.
However, a retest of the $230 billion levels is not out of the woods. The bounce up doesn’t show much strength at this point. Losing the $252-254 billion level opens up the possibility of another retest of $230 billion.
4 key levels to watch for: bullish
BTC USDT 4-hour bullish scenario
The bullish scenario is pretty straightforward for Bitcoin. The price of Bitcoin needs to hold $8,920 and preferably $9,000 as support, through which the upper resistances should be tested.
The resistances are shown at $9,300-9,400 and $9,600 (the last one is a weekly level). To be fully bullish, I’d want to see an apparent breakthrough of the $9,600 level with a high amount of volume.
The moment that the $9,400 or $9,600 level turns support, continuation towards $10,400 is the next step to go for and probably new highs. However, if these levels can’t be broken upwards, they’ll be confirmed as a bearish retest, and then lower support tests are needed.
The bearish scenario for Bitcoin

BTC USDT 4-hour bearish scenario.
The bearish scenario is also straightforward. The first scenario is a massive rejection and bearish retest at the $9,300-9,400 area (could be having a wick towards $9,600), after which the price drops down.
In case of such rejection, it’s likely to expect retests of the $8,200-8,400 to occur. Such a move would cause the markets to drop down further. An example would be a drop of Ethereum (ETH) from $250 towards $195 for some more support tests.
Another bearish scenario is whether Bitcoin can’t break above $9,150 and immediately loses the $8,920 area. Losing that zone and we’ll see momentum and $8,200 retest downwards as the primary possible outcome.
Does that look bad for the macro perspective? Not at all. The market has seen a big rally in the first weeks of this year, a retracement and correction are only healthy for a sustainable continuation of the market.