Bitcoin’s (BTC) has stalled beneath the 100-day moving average after a small price rise on the weekend brought the world’s premiere crypto back from the brink of a major bearish trend change.
The event signals an equilibrium between buyers and sellers has begun to form as the tug-o-war between $9,300 and $9,900 continues.
The longer BTC remains at resistance the greater the chance for another major sell-off as its price discovery develops.
Formerly offering its support during a strong uptrend, the 100-day moving average (MA) can now be considered as resistance after BTC moved below it on August 28.
- Bitcoin’s price action has stalled beneath the 100-day moving average, signalling indecision and increasing the odds of another sell-off.
- The daily technicals (RSI and awesome oscillator) show no signs of a relief in bearish selling pressure, at least not for the next few days.
- Should the bulls conceit defeat this week, expect another retest of $9,300 on supporting bear volume.
Daily chart
On the daily chart, prices are trapped beneath the long-term MA, hinting at a change in trend for the mid-term from bullish to bearish, supported by lower levels of total growing (bullish) volume when compared to the bears.
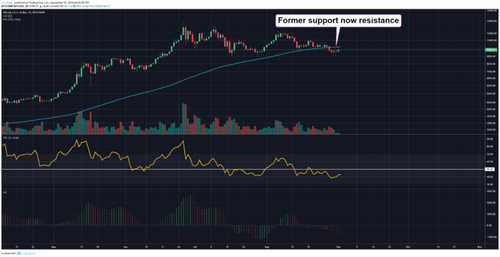
The daily awesome oscillator (AO) is yet to signal a reversal to the downtrend, as its 6th histogram bar below 0 remains red, meaning greater selling momentum continues.
Also of note, the daily RSI remains bearish below the neutral zone (50) – currently at 42.52 and showing little signs of recovery or willingness to needle higher.
Monthly chart
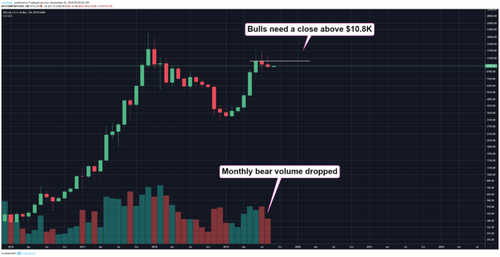
Bullish aspirations would be bolstered should a gradual move or rally above $10,800 occur by the end of the monthly closing period on September 30.
That view would be supported if buyers manage to produce enough trading volume to legitimize the move, as August proved exhausting for seller’s attempting to bring prices below $9,300 (seen by declining monthly red volume bars).
The monthly chart also reveals minimal price ranging over the last 62 days adding to the uncertainty among traders regarding the long-term trend, as a lower-low close with a large monthly wick usually produces a greater pullback.
Should the levee finally break and the bulls concede defeat this week, expect another retest of $9,300 on supporting bear volume.


