Bulls will be looking for a break above the range to signal likely price appreciation, while the bears have their eyes on the bottom for a breakdown and further downside. The price closed below the equilibrium (dashed centerline) of the range yesterday, leading to further depreciation and a likely trip to the range lows.
Bitcoin price has continued its multiple-day slide, dropping 5.3% over the past two days and 9.6% from it’s $8,800 high 5 days ago. While Bitcoin bears are celebrating, the price remains range-bound, as can be seen clearly on the daily chart.
Bitcoin price has been trading in this range since September 25th, the day after the large drop from $10,000.
BTC USD daily chart.

Monthly view: one line to rule them all
The Bitcoin monthly chart shows the most important line which coincides with the range lows on the daily chart. There are few clear support and resistance areas on this large time frame, but the price has been hovering above one of them at $7,777 for weeks. Price action above this level remains tentatively bullish, while a monthly close below would be definitively bearish and could lead to a move down to lower support levels in the low $7,000s and $6,000s.
The last 4 monthly candles look decidedly bearish, with long upper wicks on each, indicating strong selling interest from present price to the recent $14,000 highs. Bulls will look for the October candle to turn green with a long lower wick as a signal that price could be reversing and continuing its upward trend.
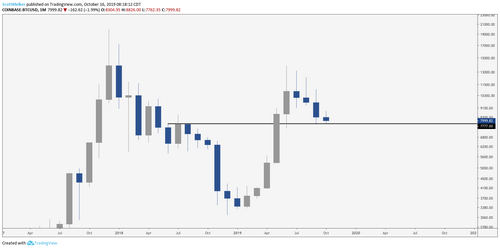
BTC USD monthly chart
The weekly chart shows clues of what is to come
A hidden bullish divergence with the Relative Strength Index (RSI) was confirmed two weeks ago and this was a strong sign of possible price appreciation. Bitcoin price moved from the range lows around $7,700 to the range highs of $8,800 on this signal.
The question now becomes whether this divergence has fully played out, or if it has more power left for a larger continuation upward. Divergences on large frames are often slow to playout but also very strong, so it’s quite possible that the price will continue up with time.
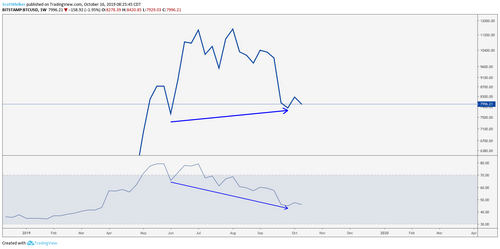
BTC USD weekly line chart.
The TD Sequential indicator is showing a red 8 on the weekly chart, a rarity on this large time frame. TD traders will be watching closely over the next 11 days to see if price can confirm a red 9, a strong signal on this indicator that price is likely to reverse. For now, this is pure conjecture and is not an indicator to be traded on.
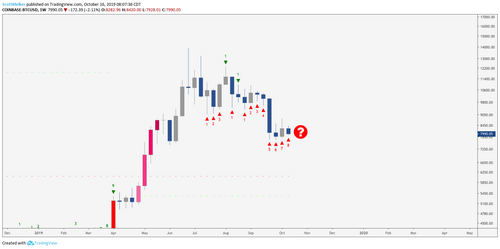
BTC USD weekly chart.
The weekly chart also shows that the price is being supported on the 50-exponential moving average (EMA). A break below this line (blue) would be a strong sell signal for bears and would likely lead to further price depreciation. This EMA has been tested on the previous 3 weekly candles, likely weakening that area of support. Bulls would rather see another test avoided with this weekly candle. This line also coincides with the range lows described above.
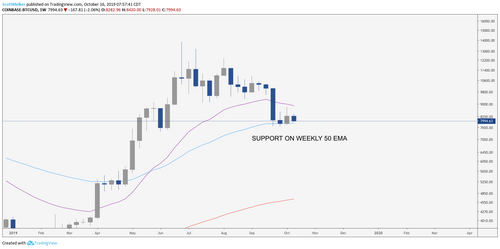
BTC USD weekly chart.
The descending channel is still valid
Bitcoin price continues to move within a descending channel which began at the local highs around $14,000. This pattern was confirmed with multiple alternating touches up and down and remains valid until a clear break below the descending support.
At present, the price is battling with the mid-range of the channel (dashed centerline). If it holds as support, traders can look for a move to the descending resistance of the channel high, which has been tested multiple times in the past few months.
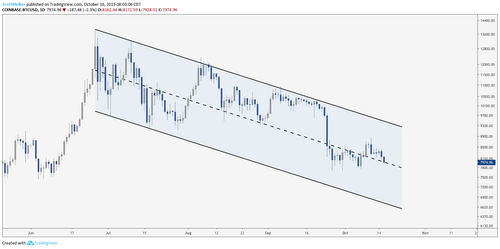
BTC USD daily chart.
As shown below, Bitcoin printed a clear bearish swing failure pattern on the daily chart at the range highs, leading to further price depreciation. The wick above the previous swing high and close below were a clear indication that liquidity was engineered for shorters and sellers.
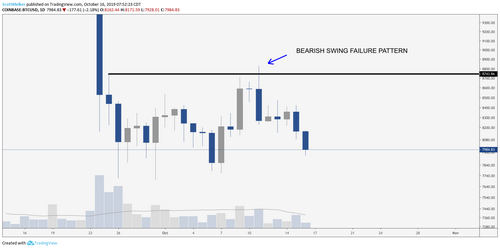
BTC USD daily chart.
The daily EMAs also hinted at bearish price action over the past week. The price was rejected concurrently at both the 200-EMA and the 21-EMA on the daily time frame, with failed tests of these lines as resistance on 3 consecutive daily candles. Further, the 21-EMA crossed below the 200-EMA the day before these three failed tests – a death cross.
Death crosses are often lagging indicators that can be strong signals when they happen close to the price action, which was the case here. Bulls will want to see both of these lines recaptured and flipped to support.

BTC USD daily chart.
Is there a bear flag?
BTC USD 4-hour chart
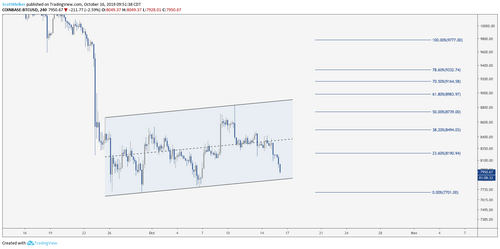
The 4-hour chart shows a clear ascending channel at the base of the large drop from $10,000, commonly referred to as a bear flag. There is debate as to whether this qualifies, as the price has been traveling in this pattern for longer than would be expected.
That said, an ascending channel is more likely to break down than up. Further, price retraced the move down to the Dow Level of 50%, a common top before further price depreciation in a bear flag.
Bullish scenario
Bulls will look to the monthly and weekly chart for signs of likely continuation towards higher highs, noting the key support level of $7,777 mentioned on the monthly and the hidden bullish divergence and 50 EMA support on the weekly chart. Holding these levels maintains the macro bullish trend.
Bearish scenario
A break and close below the key monthly $7,777 level and confluent range lows would be bearish and would likely lead to a significant movement to the downside. Bears will continue to watch the ascending channel or the bear flag that has formed on the 4-hour chart for signals that price will continue to drop.
The views and opinions expressed here are solely those of the author (@scottmelker) and do not necessarily reflect the views of Cointelegraph. Every investment and trading move involves risk. You should conduct your own research when making a decision.
