With Bitcoin halving less than nine days away, the big question troubling traders is whether the price will pump or dump following the event. Various comparisons and possibilities are being projected but in reality, no one knows with certainty how it will play out.
Therefore, traders should be ready with their plan of action for both possibilities. The uncertainty can lead to high volatility, which can offer trading opportunities both on the long side and the short side of the market.
The world is currently witnessing its worst crisis in decades, which dwarfs even the previous financial crisis. Even when traditional asset classes like equities and crude oil are struggling, Bitcoin has held out exceedingly well.
Travis Kling, the head of crypto hedge fund Ikigai, said that the top-ranked cryptocurrency on CoinMarketCap has preserved wealth for its investors as its price has “increased 0.60% from the end of February to the end of April amidst one of the most catastrophic economic events in history.”
BTC/USD
Bitcoin is in an uptrend. Both moving averages are sloping up and the relative strength index is in overbought territory, which suggests that bulls are in command.

BTC-USD daily chart.
Currently, the bears are mounting a stiff resistance close to $9,200. If the bulls can propel the price above this resistance, the momentum is likely to pick up and a quick move to $10,000 is possible.
Conversely, if the bulls fail to propel the price above $9,200, a drop to the 10-day exponential moving average ($8,320) is possible. If BTC bounces off this support, the possibility of a break above $9,200 increases as it will suggest that the bulls are not waiting for a deeper correction to buy.
However, if the bears sink the price below the 10-day EMA, a drop to the breakout level of $8,175.49 is possible. A break below this level can drag the price to the 20-day simple moving average ($7,626). Such a move will suggest that the momentum has weakened.
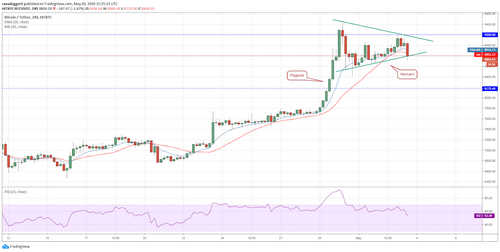
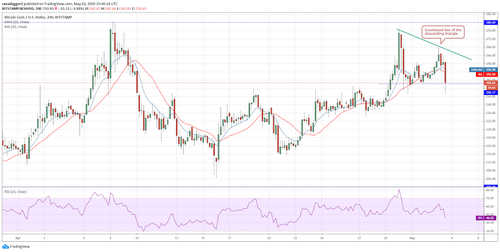
BTC-USD 4-hour chart.
The 4-hour chart shows the formation of a pennant. If the bears sink the price below the pennant, a drop to $8,175.49 and below it to $7,700 is possible.
The intraday traders can attempt a short trade with a close stop-loss if the price sustains below the pennant for four hours. As this is a counter-trend trade, the risk is high, hence, a smaller position size can be used.
Conversely, if the BTC/USD pair reverses direction from the current levels and breaks out of the pennant, the up move is likely to resume. The target objective of a break above the pennant is $10,900.
However, the bears are unlikely to give up without a fight. They would attempt to stall the rally at $10,000 and again at $10,500. Therefore, the traders can watch these levels closely and book partial profits if they find that the price is turning around.
ETC/USD
After being an underperformer for a long time, Ethereum Classic (ETC), the 19th-ranked cryptocurrency on CoinMarketCap is trying to play catch up. The breakout above the overhead resistance of $7.04147 on May 2 is a positive sign.
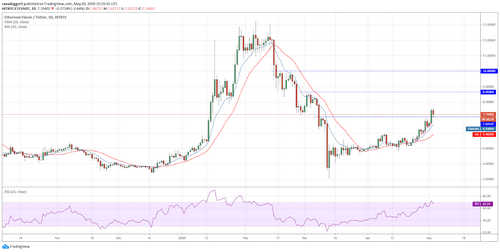
ETC-USD daily chart.
Both moving averages are sloping up and the RSI had risen into the overbought territory for the first time since early February, which suggests that the bulls have made a strong comeback.
If the bulls can sustain the price above the breakout level of $7.04147, the momentum is likely to pick up. The target objective is a move to $8.65404 and then to $10. This bullish view will be invalidated if the bears sink and sustain the price below $7.04147.
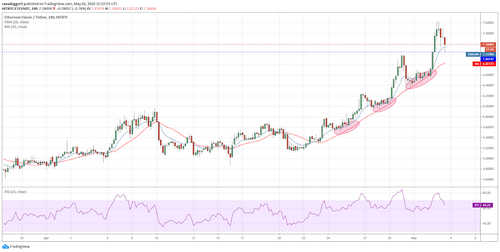
ETC-USD 4-hour chart.
The 4-hour chart shows that the ETC/USD pair has been taking support at the 20-moving average during pullbacks. This shows that the trend remains up and the bulls are using the dips to buy.
However, the bears are unlikely to give up easily. They are attempting to stall the up move closer to $7.60. Therefore, the price might consolidate near $7.05 levels for some time. Traders can wait for the pair to break above $7.63 before buying. The positions can be closed if the price sustains below the 20-MA.
Aggressive traders can buy on dips to the 20-MA after the pair starts to resume the uptrend by forming a decisive bullish bar. The stop-loss can be kept just below the 20-MA.
On the upside, traders can book partial profits in the $8.28-$8.65 zone if the bulls struggle to break above it.
TRX/USD
Tron (TRX) could be getting ready for a sharp up move within the next few days. The 15th-ranked crypto asset on CoinMarketCap is currently trading inside an ascending channel.

TRX-USD daily chart
Both moving averages are sloping up and the RSI is close to the overbought zone, which suggests that the bulls have the upper hand.
If the bulls can push the price above $0.0167242 and the resistance line of the channel, the momentum is likely to pick up. Above the channel, the first level to watch out for is $0.0183655 and then $0.0213957.
However, if the bulls fail to propel the price above the channel, a drop to the support line of the channel is likely. The trend will turn in favor of the bears if the price drops below the channel.

TRX-USD 4-hour chart.
The bears are attempting to stall the rally at the resistance line of the channel. If the price breaks and sustains below the trendline and the midpoint of the channel, the trend will weaken and a drop to the support line of the channel is possible.
This could offer a low-risk buying opportunity for the traders. The stop-loss for this trade can be kept just below the channel. The traders can initiate long positions after the TRX/USD pair rebounds off the support line of the channel.
Another trading opportunity is likely to open up after the bulls push the price above $0.0167242 and the resistance line of the channel. The traders can wait for the price to close (UTC time) above the channel before buying.
BCH/USD
Bitcoin Cash (BCH) has been trading inside a large range of $200-$280 for the past one and half months. The best way to trade an asset inside a range is to buy on a bounce off the support and sell if the price turns down from the resistance.
BCH-USD daily chart
The bulls are struggling to propel the 5th-ranked cryptocurrency on CoinMarketCap above the overhead resistance of $280. If the bears sink and sustain the price below the 10-day EMA ($248), the possibility of a drop to $220 and below it to $200 increases.
Conversely, a bounce off the 10-day EMA will signal buying on dips and will increase the possibility of a break above the range. If the price closes (UTC time) above the range, it is likely to pick up momentum and rally towards $350.
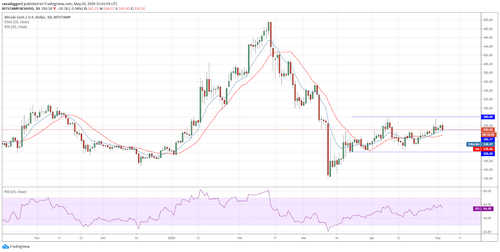
BCH-USD 4-hour chart
The 4-hour chart shows that the bears are aggressively defending the resistance of the range at $280. The BCH/USD pair is in the early stage of forming a possible descending triangle pattern that would complete on a breakdown and close (UTC time) below $250.
This bearish pattern has a target objective of $224. Therefore, the traders can initiate short positions on a close (UTC time) below $250 and keep a stop loss just above the downtrend line.
There is strong support at $236. If the bears struggle to break below this support, partial profits can be booked and the stops on the rest of the position can be trailed to breakeven. This short trade should be attempted only if the overall sentiment turns negative.
Conversely, if the price rebounds off $250 and breaks above the downtrend line, the bulls will once again attempt to propel the price above the range. If successful, the uptrend is likely to pick up momentum.
Therefore, if the sentiment remains bullish, the traders can wait for the price to close (UTC time) above $280 before initiating long positions. The first short-term target objective is $310 and above it $330.
XLM/USD
Stellar Lumens (XLM) has again found a place in our list as it is an outperformer and is in a strong uptrend. A pullback in an asset with a strong uptrend offers a low-risk entry opportunity to the traders who had missed out buying at lower levels.

XLM-USD daily chart
The 11th-ranked cryptocurrency on CoinMarketCap has not closed below the 10-day EMA since April 16. This is a huge positive as it shows that the bulls are not waiting for a deeper correction before buying.
Currently, the bears are attempting to reverse direction from $0.076994. If the price breaks below $0.071, a drop to the 10-day EMA ($0.068) is possible. A bounce off the 10-day EMA can offer a buying opportunity with a close stop loss. On the upside, the target is $0.08 and above it $0.088777.
Conversely, if the bears sink the price below the 10-day EMA, a deeper pullback to the 20-day SMA ($0.059) is possible.

XLM-USD 4-hour chart
The 4-hour chart shows that the RSI is forming a bearish divergence, which suggests that the XLM/USD pair is losing momentum.
If the bears sink the pair below the uptrend line, a drop to $0.0673 is possible. A strong bounce off this level will indicate strength but if this level breaks down, the pullback can extend to the strong support at $0.060.
A strong bounce off $0.060 can offer a low-risk buying opportunity with a close stop loss. However, if this support cracks, it will indicate weakness. Hence, traders can avoid initiating long positions on a break below $0.060 until the pair shows signs of a turnaround and forms a bullish setup once again.