So far, $9,730 has functioned as a level of support and a pullback below this point could see the price drop slightly below the Bollinger Band moving average at $9,450 and below this, the 6-hour chart shows the possibility of a bounce at the 50-day moving average ($9,350).
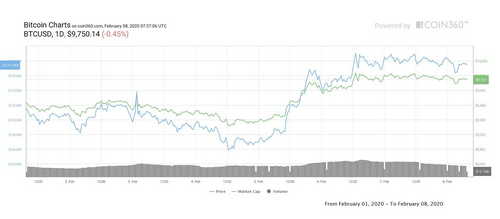
After an impressive performance over the past two weeks, Bitcoin price appears to be taking a breather which on Feb. 7 saw the price trade in the $9,730 to $9,800 range.
The weekly high at $9,910 appears to be standing as resistance and the price traded sideways under this level throughout the day.
BTC USD daily chart
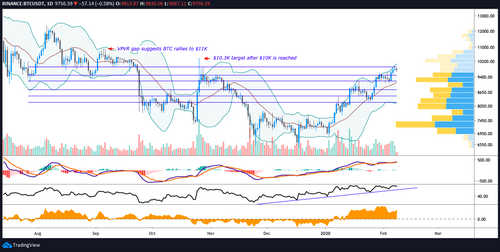
If the digital asset is entering a period of consolidation, it would be perfectly natural for it to revisit the lower support at $9,472, as was the case during the previous weeks when Bitcoin climbed from $7,300 in a step and stairway pattern.
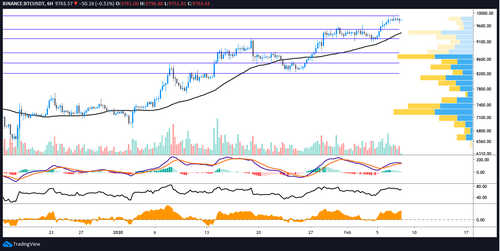
BTC USD 6-hour chart
The volume profile visible range (VPVR) also shows a high volume node at the $9,472 support, hence the prediction that the price could bounce if it pulls back to this area. The same can be said for the 50-MA at $9,350.
BTC USD daily chart.
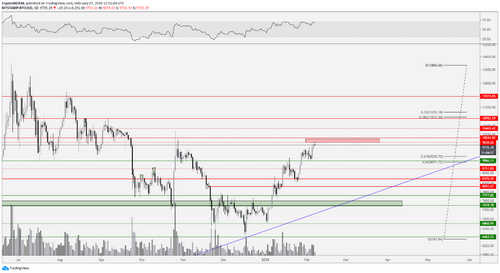
On Feb. 7, Cointelegraph contributor Michaël van de Poppe tweeted that Bitcoin price appears to have reached a temporary top and he elaborated by posting the above chart and saying:
“Still, I think we’re going to top out for a bit here and just make a sideways range. Identical, the best would be $8,750-9,000 as long entries. Doubt we’ll get it…breakthrough here and targeting $10,400-10,900.”
At the time of publishing the relative strength index (RSI) is pulling back from 70 (overbought territory) on the daily timeframe, a level which saw Bitocin price retract when reached on Jan. 30, Jan. 27, Jan. 18 and Jan. 14.
While the shorter time frame currently hints that Bitcoin price is in for a bit of consolidation, the weekly time frame is still resoundingly bullish.
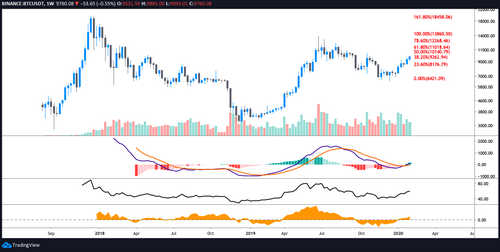
BTC USD weekly chart
Traders will note that the weekly Moving Average Convergence Divergence (MACD) remains in the midst of a bull cross, a somewhat rare event that marks the beginning of a strong bull trend.
Swing traders and hodlers will have interpreted this as a buy and hold signal and will be looking forward to the coming months with great excitement.
Bitcoin weekly price chart
The overall cryptocurrency market cap now stands at $278.1 billion and Bitcoin’s dominance rate is 63.8%. Altcoin price action was relatively flat, with a handful of the top-20 altcoins posting marginal gains and a few registering small single-digit losses.
A few standout performers were Bitcoin SV (BSV) which gained 14.21%, Dash (DASH) was up 6.29%, and Dogecoin (DOGE) with a 7.56% gain.

