Manuel Andersch, senior FX analyst at the Bayerische Landesbank has published a report, which suggests that the “forthcoming halving effect has hardly been priced into the current Bitcoin price.” Using a stock-to-flow ratio metric, the report projects a target price of $90,000 for Bitcoin in 2020.
Chicago Mercantile Exchange (CME) Group has said that they do not have any plans to launch a Bitcoin settled futures contract. The CME said that the number one demand of their customers was options on futures, which the group plans to introduce in the first quarter of 2020, pending regulatory approvals.
Though there were great expectations for the launch of Bakkt, it turned out to be a dud. A new report by Binance research suggests that the disappointing trading volume on Bakkt might have triggered the recent fall in Bitcoin.
In another sign that markets are maturing, global crypto wash trading declined by over 35% in September, according to the latest surveillance report from the Blockchain Transparency Institute.
After the recent fall, major cryptocurrencies are trying to form a bottom. Do we find any buying opportunities? Let’s find out.
BTC/USD
The pullback in Bitcoin hit a wall just above $8,500 on Oct. 1. This is a bearish sign because it shows a lack of buyers at higher levels. We were expecting the pullback to at least reach the breakdown level of $9,080. The bears will now try to sink the price back to the recent low of $7,702.87. If this support breaks, a decline to the $7,337.78–$7,451.63 zone is likely.

Both moving averages are sloping down and the RSI is in oversold territory, which indicates that bears have the upper hand. The next dip toward the recent lows of $7,702.87 will give us a better insight on whether this is a great buying opportunity or will the prices fall further.
If a strong bounce from the recent lows breaks out of $8,502.61, the possibility of a rally to $9,080 increases. This period of uncertainty is unlikely to continue for long. We anticipate a sharp move in either direction within the next few days.
ETH/USD
The bulls could not propel Ether (ETH) above the 50-day SMA on Oct. 1. However, the buyers are attempting to keep the price above $173, which is a positive sign. If the bulls defend $173, we anticipate another attempt to break out of the moving averages within the next couple of days. If successful, a move to $203.708 is possible.
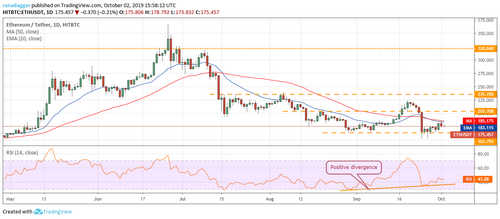
However, if the ETH/USD pair slips below $173, it can again drop to $163.755. If the bears sink the price below this support, a retest of $151.829 will be in the cards. We will wait for the price to sustain above the moving averages to suggest a long position. Aggressive traders, however, can hold their positions recommended in the previous analysis.
XRP/USD
XRP could not break out of the moving averages, which shows that sellers are active at higher levels. It has turned down and is near the critical level of $0.24508. If the bears sink the price below this level, a dip to $0.22 is possible. Below this, the next support is at $0.19.
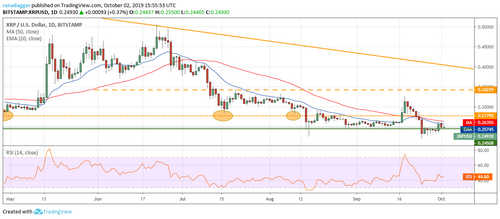
Nonetheless, if bulls defend the support at $0.24508, there will be one more attempt to push the price above the resistance zone of 50-day SMA and $0.27795. A breakout of this zone will indicate that the recent breakdown to a new 52-week low was a bear trap. Traders can wait for the XRP/USD pair to close (UTC time) above $0.27795 to buy. The stop loss can be kept at $0.215. The first target on the upside is $0.34229 and above it $0.40.
BCH/USD
The pullback in Bitcoin Cash (BCH) lacks strength. This shows that buyers are in no hurry to initiate long positions at these levels. The downsloping moving averages and the RSI close to the oversold zone show that any relief rally will face stiff resistance at the neckline of the head and shoulders pattern.
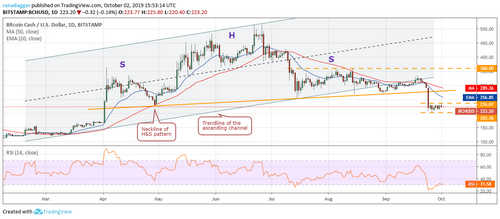
If the price turns down from the neckline, the bears will try to resume the down move. Below $203.36, the next support on the way down is at $166.98.
However, if the BCH/USD pair can break out and sustain above the neckline, it will indicate that the current breakdown was a bear trap. As the pair has broken down after forming a bearish pattern, we will play it safe and wait for a new buy setup to form before recommending a trade in it.
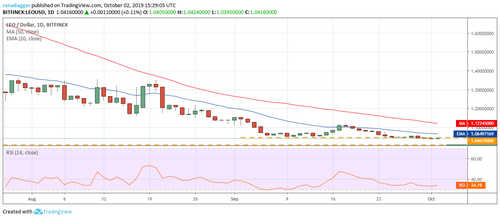
LTC/USD
Litecoin (LTC) is currently trading inside a tight range of $58.2512–$50. As the price has been trading close to the upper end of this range, a breakout looks likely. The next resistance to watch on the upside is $62.0764 and above it the downtrend line.
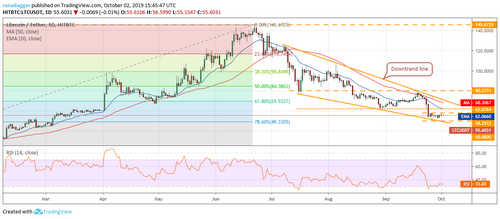
The downsloping moving averages and the RSI close to oversold zone shows that pullback attempts will face selling at resistance levels. If the price turns down from either resistance level, the bears will attempt to resume the downtrend. A break below the recent lows of $50 will be a huge negative.
On the other hand, if the bulls push the price above the downtrend line, a trend change is likely. The next level to watch on the upside is $80.2731, above which the uptrend is likely to pick up momentum. We will wait for a new buy setup to form or for the price to break out of the downtrend line before proposing a trade in it.
EOS/USD
The bulls could not push EOS above the previous support-turned-resistance of $3.1534 on Oct. 1. This is a bearish sign as it shows a lack of demand at higher levels. The bears will now try to sink the price back below the recent lows of $2.4001. If successful, the downtrend will resume.
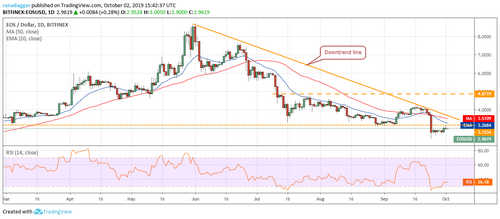
However, if the EOS/USD pair consolidates close to $3.1534 and does not give up much ground in the next few days, it will indicate strength. A breakout of $3.1534 will carry the price to the downtrend line. This is an important resistance to watch out for because if the price scales above this, a move to $4.8719 is possible. We will wait for the price to break out and close (UTC time) above the downtrend line before suggesting a long position in it.
BNB/USD
Binance Coin (BNB) has been stuck between $16.4882 and $14.2555 for the past seven days. This shows that both buyers and sellers are playing it safe as they are not confident about the next directional move. The downsloping moving averages and RSI in the oversold zone show that bears are in the driver’s seat.
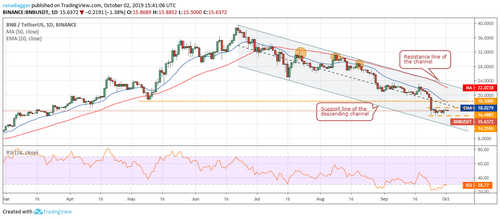
A breakdown of the range will resume the down move that can drag the BNB/USD pair to the support line of the descending channel. Conversely, if the bulls push the price above the range, a move to the 20-day EMA and above it to the 50-day SMA is possible. A breakout of the resistance line of the channel will indicate that the downtrend is over. We will wait for a reversal pattern or a breakout of the channel before recommending a trade in it.
BSV/USD
The shallow pullback in Bitcoin SV (BSV) in the past two days shows a lack of buying interest at higher levels. We now expect the bears to attempt a breakdown of the tight range. If the price slips below $78.506, a retest of $66.666 will be in the cards. The downsloping moving averages and RSI in oversold territory show that bears are in command.
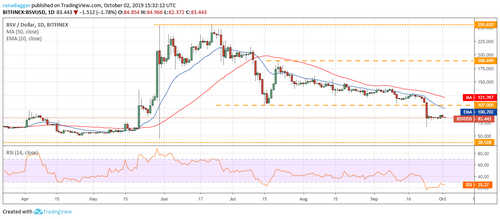
However, if the bulls defend the minor support at $78.506, the BSV/USD pair will extend its stay inside the tight range. The pair will start a trending move after a sharp breakout or breakdown from the current levels. We will wait for a large range move on the upside to sustain before proposing a trade in it.
XLM/USD
The bulls failed to push Stellar (XLM) above the 20-day EMA in the past two days. It can now correct to $0.055901, which is a minor support. If this support cracks, the next stop is likely to be $0.051014. A drop to new lows will be a huge negative.
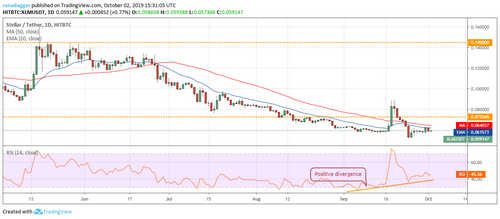
We are closely watching the positive divergence on the RSI as it is a bullish sign. If the XLM/USD pair breaks above the 50-day SMA, it will offer a trading opportunity to the aggressive traders. Hence, we retain the buy recommendation given in the previous analysis. Risk-averse traders can wait for a reversal pattern to form before buying it.
LEO/USD
UNUS SED LEO (LEO) has been gradually grinding lower. It has sustained below $1.0467 for the past three days, which shows that buyers are not urgent to buy even at these levels. Both moving averages are sloping down and the RSI is close to the oversold zone, which shows that bears have the upper hand.
The next support on the downside is $1.0075. As this is the lifetime low, we anticipate bulls to aggressively defend it. However, a bounce off it will face resistance at the moving averages. The LEO/USD pair will indicate signs of a turnaround after closing (UTC time) above $1.1217. Conversely, if the bears sink the price below $1.0075, the pair will weaken further and can dip to $0.80.
