Bitcoin may be close to bottoming out, as a popular contrary indicator is teasing a bearish turn for the first time since March 2018.
Potentially producing a so-called death cross, the 50-day moving average is falling fast and may drop below the 200-day MA over the next week or so.
A death cross is a long-term bear market indicator, according to technical analysis theory. In reality, however, it is a lagging indicator and often ends up trapping sellers on the wrong side of the market, as seen in the charts below.
If confirmed, the chart event would be the first such crossover of these averages since March of last year.
- Bitcoin’s 50- and 200-day moving averages (MAs)look set to produce a death cross in the next week or two. Historical data shows the cryptocurrency could bottom out if the cross is confirmed.
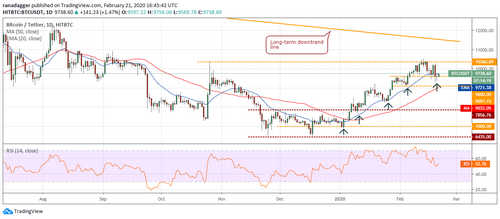
- BTC may drop to support near $7,430 before then.
- A break above $8,820 is needed to invalidate the bearish lower-highs set up and confirm a bullish reversal.
The 50-day MA fell below the 200-day MA on March 31, 2018 (above left), following which the sell-off stalled around $6,500 and the cryptocurrency rose back to highs near $10,000 in the first week of May.
Note that the relative strength index (RSI) was reporting oversold conditions when the crossover happened.

A market is often oversold by the time a cross is confirmed, as the MAs are based on past data and the crossovers are a product of price rallies or sell-offs.
In mid-September, 2015, bitcoin’s pullback from highs near $250 also ran out of steam near $220 with the confirmation of a death cross.
The cryptocurrency remained sidelined in the range of $220–$250 in the following weeks before breaking into a bull market at the end of October 2015. What followed was a meteoric rise to a record high of $20,000 by December 2017.
The impending crossover may also turn out to be a bear trap, as bitcoin will most likely be oversold by then, having dropped more than 40 percent already from June’s high of $13,800.
Additionally, the cryptocurrency is set to undergo a mining reward halving in May 2020 and may repeat history by picking up a strong bid six months ahead of the event, as pointed out by popular analyst @100trillionUSD.
That said, the ongoing pullback from the recent highs above $8,800 looks to have legs, as per the technical charts. Therefore, bitcoin will likely remain on the defensive in the days leading up to the crossover and bottom-out below recent lows near $7,750.
The spread between the 50- and 200-day MAs currently stands at $417 – the narrowest since early May – and indicates that bullish sentiment is at its weakest in over five months.
Daily, 6-hour and weekly chart
Bitcoin bounced up from the 100-week moving average last week and witnessed a double bottom breakout on the 6-hour chart (above left).

Even so, the cryptocurrency failed to take out the 200-day MA on Oct.11 (above right) and has dropped to levels below $8,000, forming a bearish lower high pattern above $8,800.
Put simply, the bearish sentiment is still quite strong and a deeper slide below the 100-week moving average at $7,755, possibly to support near $7,430 (multiple daily lows in early June) could be in the offing ahead of the death cross confirmation.
The outlook would turn bullish if and when prices rise above $8,820, invalidating the bearish lower highs setup.