The top cryptocurrency by market value closed (UTC) well above $7,100 on Wednesday, marking an upside break of the 200-period moving average on the three-day chart.
The breakout could now invite stronger chart-driven buying, as a move above the long-term technical line is often considered a confirmation of a bearish-to-bullish trend change.
The risk-on action seen in traditional markets is also supportive of further gains for bitcoin. Major European indices like Germany’s DAX and the U.K.’s FTSE are currently reporting slight gains. Asian stocks also rose early on Thursday following an overnight surge on Wall Street.
The 200-period average had repeatedly capped upside in the final days of March. Now that the hurdle has been convincingly crossed, buyers who entered the market earlier this month may also be more comfortable in holding their positions. All in all, the move is a good signal for prices.
- Bitcoin’s break above a long-term moving average resistance near $7,100 has strengthened the case for a rally to $8,000.
- A drop in trading volumes is a cause for concern for the bulls, however.
- The outlook will remain bullish as long as prices are holding above support near $6,800.
After multiple failed attempts, bitcoin (BTC) has finally broken above key resistance, bringing a boost to the short-term bullish case.
The sentiment seems to have been buoyed by reports that the U.S. and European nations are discussing plans to reopen their respective economies at the start of May. Most countries imposed lockdowns of varying degrees of severity in March in order to contain the coronavirus outbreak, negatively impacting commerce.
At press time, bitcoin is changing hands near $7,340, representing a 0.80 percent increase on a 24-hour basis., according to CoinDesk’s Bitcoin Price Index. That’s well above the 200-period average at $7,093.
The cryptocurrency has recovered by more than $3,400 from the low of $3,867 reached during the early Asian trading hours on March 13 and is now just $700 short of levels near $8,000 seen ahead of the price crash seen March 12.
Three-day chart

Bitcoin repeatedly failed to cross the 200-period average hurdle in the three weeks to April 5, weakening the immediate bullish case and raising the odds of a price pullback.
However, the breakout confirmed by the previous green candle, representing price action for April 6-9, indicates that the rally from lows below $4,000 has resumed.
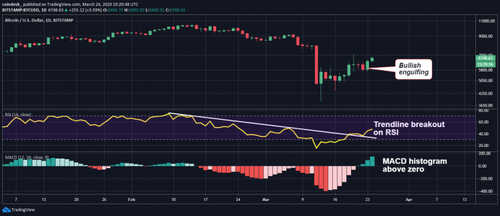
The MACD histogram, an indicator used to identify trend strength and trend changes, has crossed above zero, signaling a bearish-to-bullish trend change. Further, the Chaikin money flow index is hovering above zero – a sign buying pressure is outweighing selling pressure.
All in all, there is a strong case to believe bitcoin will test psychological resistance at $8,000 in the short-term.
Daily chart

Bitcoin is trapped in an ascending price channel, as seen above.
Monday’s green marubozu candle, which marked a breakout above $7,000, points to bullish market sentiment. The five- and 10-day averages are trending north, indicating strong upward momentum.
The only cause for concern for the bulls is a decline in trading volumes. A low-volume rally often ends with a notable price drop.
That said, the bias will turn bearish only if prices drop below $6,773 (horizontal line). That would invalidate the marubozu candle created on April 6 and open the doors for a pullback to $5,856 (March 30 low).