Bitcoin has dived out its recent trading range, opening the doors for a pullback to deeper support levels. The drop to nine-day lows confirmed a downside break of the recent trading range of $8,460 to $8,750.
The cryptocurrency had entered consolidation mode during Sunday’s U.S. trading hours after the sudden reversal lower from highs near $9,200 range out of steam at $8,460 – the level, which saw bitcoin turn lower on Jan. 8.
So it seems safe to say the pullback from $9,200 has resumed with the range breakdown and a deeper drop to support at $8,200 and $8,000 could be in the offing.
The top cryptocurrency ran into offers around $8,580 at 08:35 UTC and fell through the long-held support of $8,460 in a few minutes to hit a low of $8,340 – a level last seen on Jan. 14, according to CoinDesk’s Bitcoin Price Index.
- Bitcoin’s range breakdown has opened the doors for a deeper pullback to support levels at $8,200 and $8,000.
- The short-term indicators have turned bearish, supporting the case for further losses.
- A move above $8,750 is needed to revive the immediate bullish view.
- The broader outlook will remain bullish as long as prices are holding above $7,700, according to the weekly chart.
At press time, bitcoin is changing hands near $8,415, representing a 2.72 percent drop on a 24-hour basis.
4-hour chart
The range breakdown has created room for a drop to at least $8,170 (target as per the measured move method).
Bitcoin charted multiple four-hour candles with highs around $8,200 in the Jan. 11-13 period. As a result, $8,200 is a key support to watch out for. On similar lines, the psychological level of $8,000 is also crucial support.
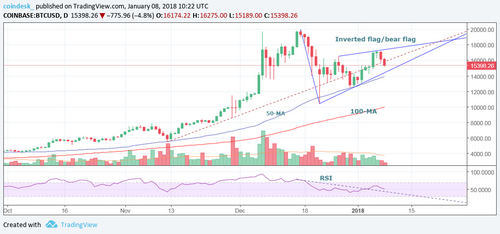
On the higher side, $8,750 is the level to beat for the bulls. A sustained move at that level would revive the short-term bullish view and allow a re-test of recent highs near $9,200.
However, a break above $8,750 looks unlikely, as the short-term indicators have made a bearish shift.
Daily chart
The MACD histogram, which is widely used to gauge trend strength and trend reversals, has crossed below zero, confirming a bullish-to-bearish trend change.
The five- and 10-day moving averages (MAs) have produced bearish crossover.
8-hour chart
Bitcoin has lost its upward trajectory, as indicated by the «ascending pitchfork» breakdown.
The ascending pitchfork is a trend channel tool consisting of a median line in the center with two parallel equidistant lines on either side. These lines are drawn by from three points, representing a bottom, a correction high and a higher low.
All in all, the odds
appear stacked in favor of a drop to $8,200 and possibly to $8,000.
Weekly chart
Bitcoin broke out of a six-month-long falling channel two weeks ago, confirming a long-term bullish reversal. The setup will remain valid as long as prices are holding above $7,700.