Rager is also expecting bitcoin’s price volatility to rise soon, as the Bollinger bands have converged sharply over the last few days. A low-volatility period, as seen in the last two weeks, often ends with a big move on either side.
Bitcoin appears likely to drop below $8,000, despite having scaled a widely tracked technical resistance level.
At time of writing, BTC seems to have found more solid acceptance above the 20-day MA, having defended the level at $8,252 during the Asian trading hours on Monday.
The top cryptocurrency by market value is trading above the 20-day moving average for the first time since mid-September. The MA line was crossed multiple times over the weekend, but on each occasion the breakout was brief.
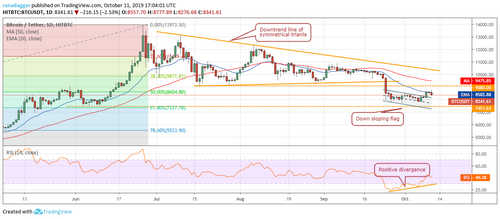
- Bitcoin has crossed the 20-day moving average (MA) hurdle but remains in bearish territory below the long-term resistance of the 200-day MA.
- Daily and weekly charts indicate scope for a drop to $7,750.
- A UTC close above the 200-day MA at $8,718 is needed to weaken the bearish case.
The move above the 20-day MA is good news, according to popular analyst Josh Rager.
While some traders may anticipate a big move to the higher side, given the price has scaled the 20-day MA, the technical charts remain bearish. Further, prices are still holding well below the key 200-day MA, which has acted as strong resistance over the last 2.5 weeks.
Daily and 4-hour charts
BTC carved out a large bearish outside bar reversal candle on Friday (above left), signaling an end of the recovery rally and shifting risk in favor of a drop below $8,000. That candle is still valid with prices holding well below the high of $8,820 hit on Friday.
As mentioned, the cryptocurrency is trading well below the 200-day MA at $8,718 (above left). BTC has failed to close above the long-term average multiple times since Sept. 27, dampening prospects of a stronger recovery rally and making it the level to beat for the bulls.
Above right, the 4-hour chart is reporting a failed double bottom breakout and a rising channel breakdown – a bearish setup.
Weekly chart
BTC ended last week on a positive note, but faced rejection at the 5-week MA, reinforcing the downward sloping average’s bearish bias.
The 5- and 10-week MAs continue to trend south this week, while the relative strength index (RSI) is holding bearish below 50.
All-in-all, BTC risks falling below $8,000 and extending losses, possibly to the 100-week MA support at $7,760, in the short term.
The bearish case would weaken if prices find acceptance above the 200-day MA at $8,718, but that looks unlikely at press time.