The top cryptocurrency by market capitalization picked up a bid at lows below $9,900 on Wednesday and rose past $10,100 yesterday, confirming a falling-wedge breakout on the 4-hour chart.
Bitcoin has regained poise in the last 48 hours and could revisit recent highs in the next couple of days, charts suggest.
The low-volume correction, however, ended with a bullish breakout on Thursday and the cryptocurrency is now looking north, and a re-test of the bearish lower high of $10,956 could be in the offing in the next couple of days.
The falling wedge pattern, comprising of converging trendlines connecting lower highs and lower lows, was created during the pullback from last Friday’s high near $10,956 (bearish lower high of Aug. 20) to Wednesday’s low of $9,855.
- The 4-hour chart is reporting a bullish breakout. As a result, bitcoin could challenge key resistance at $10,956 in the next few days.
- Daily chart indicators also indicate scope for a retest of recent highs.
- A UTC close above $10,956 (Aug. 20 high) would activate twin bullish cues and open the door to $12,000.
- A high-volume break below Wednesday’s low of $9,855 would revive the bearish view, although, that looks unlikely.
As of writing, BTC is changing hands at $10,320 on Bitstamp, having hit a high of $10,458 earlier today.
4-hour chart
The falling-wedge breakout is backed by an above-50 reading on the relative strength index (RSI). The indicator has also breached the falling trendline.

Further, the moving average convergence divergence (MACD) histogram is printing bars above the zero line, indicating bullish conditions. Meanwhile, the Chaikin money flow (CMF), which takes into account both prices and trading volumes, is also holding above zero – a sign of strengthening buying pressure.
As a result, further gains to levels above $10,900 look likely.
Daily chart
BTC created a long-tailed candle on Wednesday, indicating seller exhaustion below $10,000. Similar daily candles (marked with arrows) have consistently marked temporary bottoms and fueled minor price rallies over the last 10 weeks.
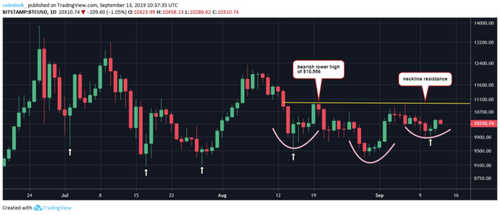
Hence, there is a strong case for a rise to the bearish lower high of $10,956.
BTC also appears to be forming the right shoulder of an inverse head-and-shoulders pattern with the neckline resistance near $10,956.
So, a UTC close above that level would activate twin bullish cues: invalidation of bearish lower highs and an inverse head-and-shoulders breakout.
The latter would create the room rise to $12,590 (target as per the measured move method).
On the downside, $9,855 (Wednesday’s low) is the level to beat for sellers, although that looks unlikely at press time.