Bitcoin’s (BTC) double-digit drop has torn down the scaffolding of what had seemed to be a developing long-term bull market just days ago.
That said, a bearish reversal is still not confirmed either, technical studies indicate.
At press time, the leading cryptocurrency is changing hands at $6,422 on Bitfinex – down 13 percent from the previous day’s high of $7,404.
Notably, BTC has erased all the gains made over the last two weeks in a single day. Further, the sharp drop has poured cold water over the optimism generated by the falling channel breakout and the bullish turn of the weekly MACD.
Still, it is premature to call a long-term bullish-to-bearish trend change, as the prices are holding well above the crucial support of $6,000.
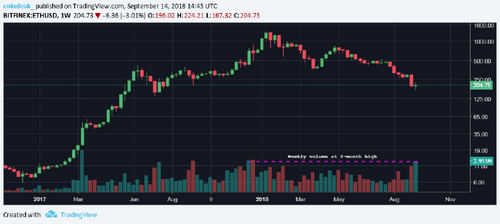
Weekly chart
As seen in the above chart, the bears have repeatedly failed in the last 11 weeks to secure a weekly close (Sunday’s UTC close) below $6,000 (Feb. 6 low), signaling the sell-off from the record high of $20,000 has run out of steam.

Hence, the bears will likely feel emboldened if BTC closes the week below $6,000.
One way to gauge whether BTC is likely to end this week below the significant support level is to study the line chart. This paints a better picture of the broader trend by focusing only on the UTC close, unlike the candlestick chart, which also takes into account the daily high and low.
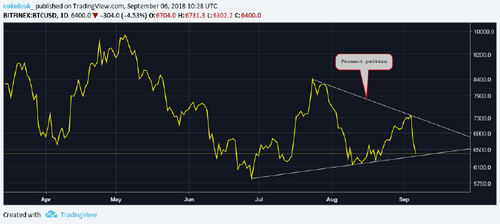
Daily line chart
As can be seen, BTC has charted a pennant pattern on the daily line chart. A UTC close below the pennant support of $6,340 would signal a revival of the long-term bear market. Thus, the probability of BTC ending the week below $6,000 would rise sharply on pennant breakdown.
That said, the sell-off is now looking overstretched on the short-duration charts, and a bearish close is looking unlikely.
4-hour RSI chart
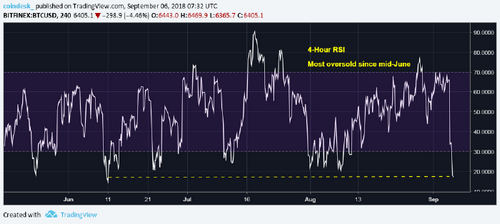
The relative strength index (RSI) on the 4-hour chart is hovering at its lowest level since June 11, signaling extreme oversold conditions. A similar sentiment is being echoed by the hourly chart RSI. Hence, a minor corrective rally cannot be ruled out.
View
- BTC’s drop to the low of $6,302 has neutralized the long-term bullish outlook.
- Prices could drop to $6,000, albeit after a minor corrective rally due to intraday oversold conditions.
- A weekly close below $6,000 would confirm a bearish reversal.
- The odds of BTC ending this week below $6,000 would go up if bitcoin closes below the pennant support (line chart) for two consecutive days.
- In the short-term, $7,429 (Sep. 2 high) is the level to beat for the bulls. Meanwhile, a convincing move above the July high of $8,507 would confirm a long-term bullish reversal.